
State of the Borough Dashboard
This dashboard paints a picture of CW&C using a range of statistics.
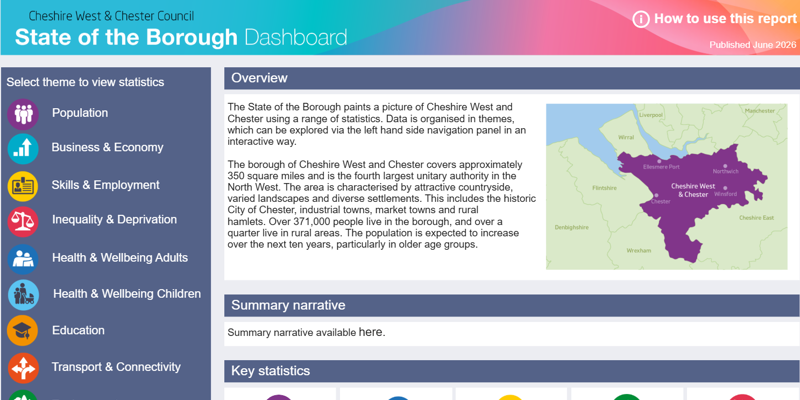
This dashboard paints a picture of CW&C using a range of statistics.
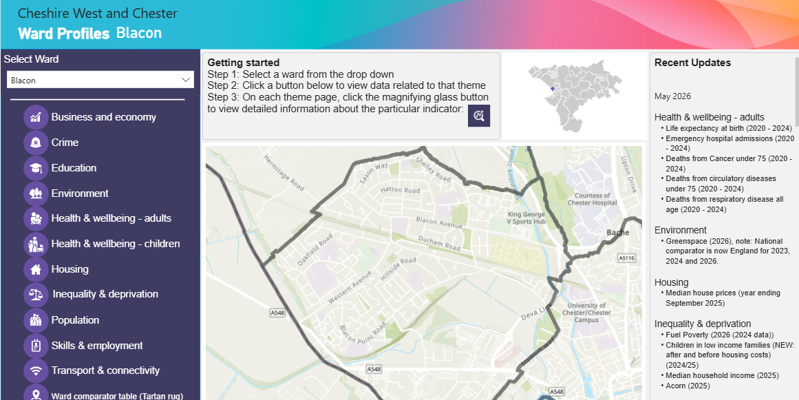
An interactive report providing statistics for each of our 45 wards.
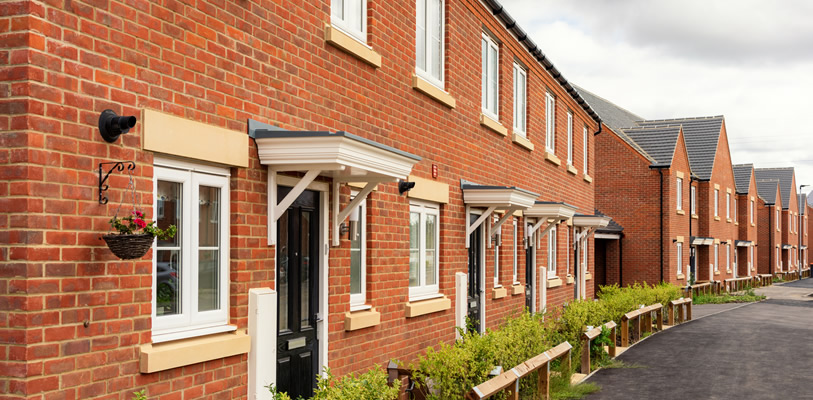
Providing a detailed picture of local communities by classifying households into population segments.
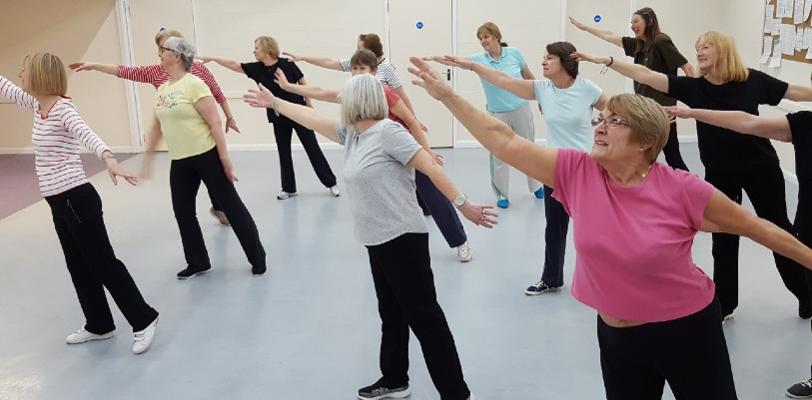
Providing statistics on a range of indicators often linked to higher risk of loneliness.
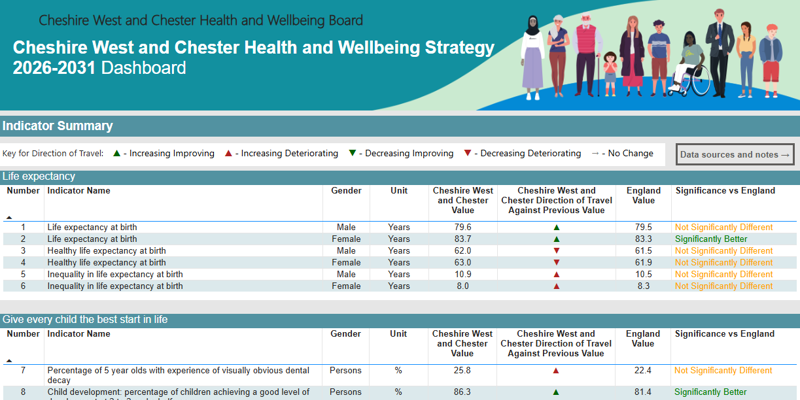
Developed to monitor the progress of the Health and Wellbeing Strategy.
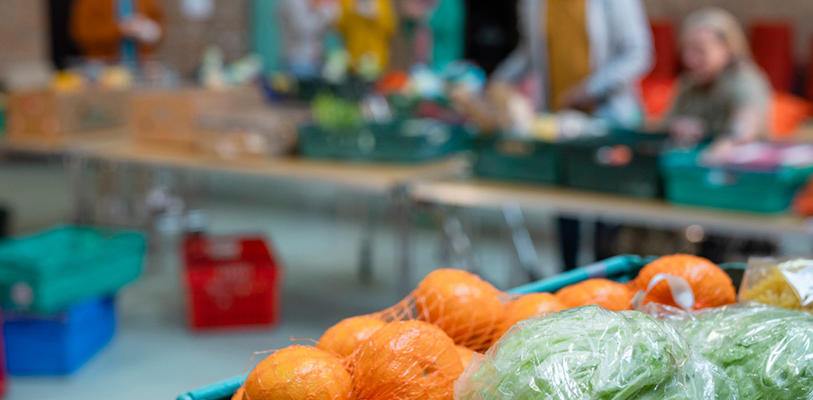
Providing information on food availability and accessibility in CW&C.